
EPC
Used as
- Card
Summary
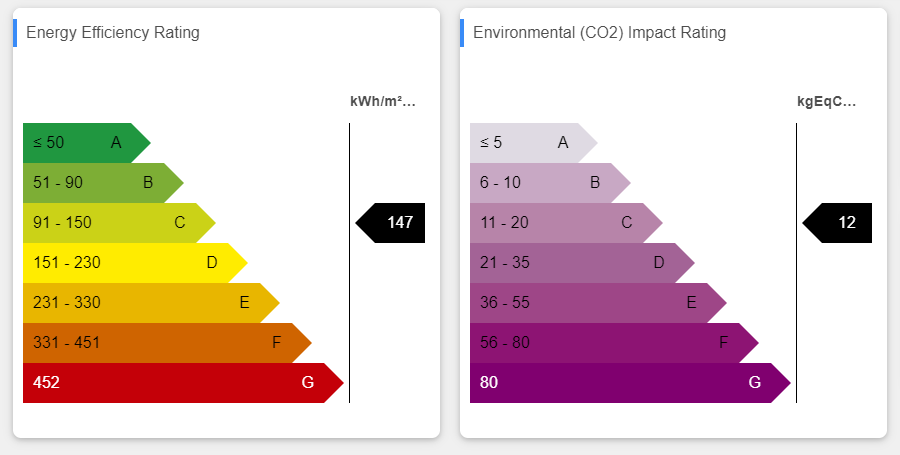
Display an EPC graph (EER or EIR) for a selection of histories over a given period. It takes into consideration whether it's gas, elec or fuel consumption.
Implementation
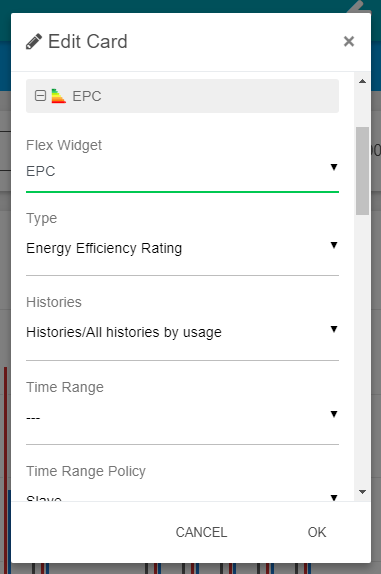
- Add a card from the settings bar, and choose in the list EPC
- Choose a selection of histories (Histories field)
- Choose a period (Period field)
- Fill the tags fields to distinguish between the different sources of histories (electricity, gas and fuel).
- You can make it slave of another card. See Master Slave behavior between cards to have more information on how to use it with other cards
Flex Widget Properties
- Type: The type of graph to display: EER (Energy Efficiency Rating) or EIR (Environmental (C02) Impact Rating).
- HistoryDefaultSelection: A list of queries retrieved from the Selection folder in the BtibService. The selected query needs to point histories (history:).
- TimeRangeDefaultSelection: The time range to apply to the retrieved histories.
- TimeRangeSelectionPolicy:
- Stand Alone: The widget takes the time range from the properties
- Slave: The time range is given by another widget like a period selector.
- Delta: whether to compute the relative difference between each value
- Auto: Will compute the difference according to the tag "delta" present on the history. Apply false if the tag doesn't exist.
- True: Will always compute the difference
- False: Will never compute the difference
- Area: The surface area used to compute the ratio. You can use SFormat to retrieve the area in a slot in the station.
- Elec Tag: The tag associated with electricity histories.
- Gas Tag: The tag associated with gas histories.
- Fuel Tag: The tag associated with fuel histories.
- Elec Coef: Coefficient to apply on electricity consumption (default 2.58).
- CO2ElecCoef: (EIR graph) Coefficient to apply on electricity consumption percentage ratio (default 0.023).
- CO2GasCoef: (EIR graph) Coefficient to apply on gas consumption percentage ratio (default 0.055).
- CO2FuelCoef: (EIR graph) Coefficient to apply on fuel consumption percentage ratio (default 0.074).
- LegendTop: The legend to display on the top of the graph.
 SFormat is supported.
 - LegendBottom: The legend to display on the bottom of the graph. SFormat is supported.
- ValueTitle: The title for the value column. SFormat is supported.
- ShowValueWithScaleName: Display the value with the scale name instead of a number.
- ShowValueWithScaleColor: Display the value with colors associated with the scale.