Used as
Summary
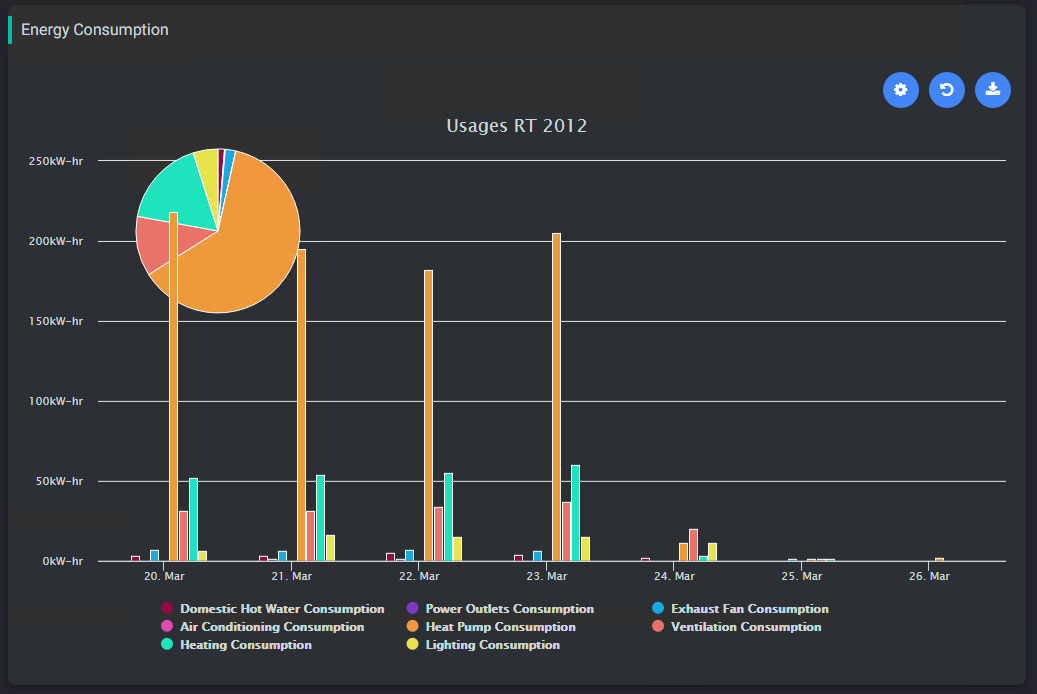
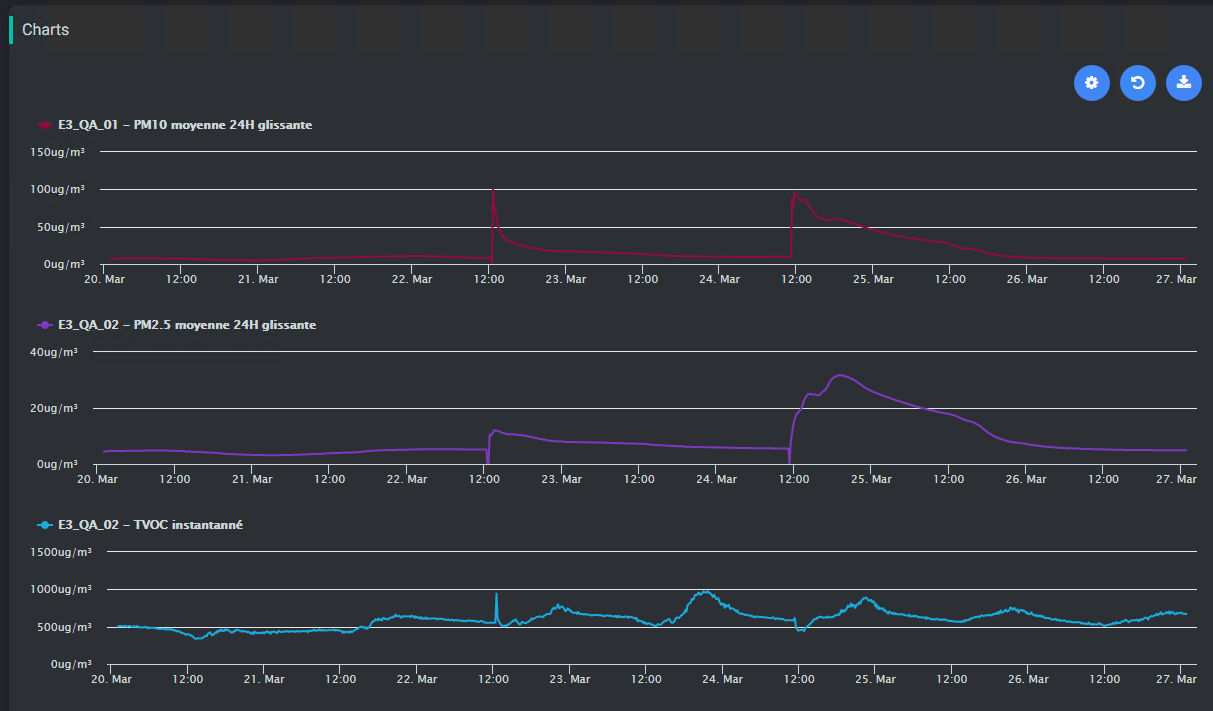
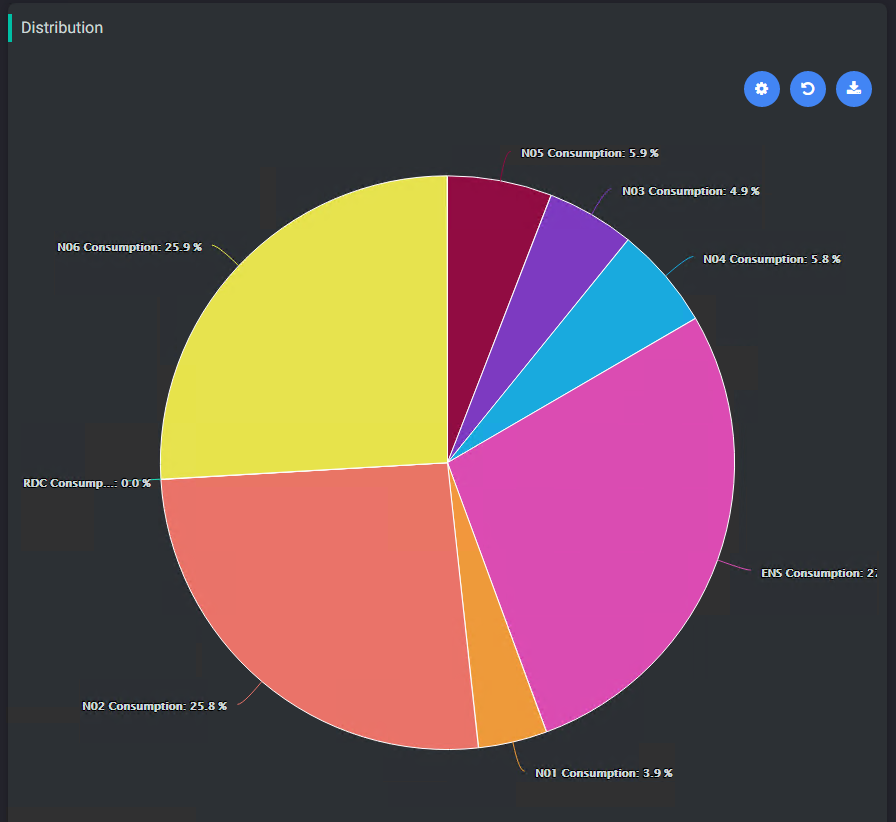
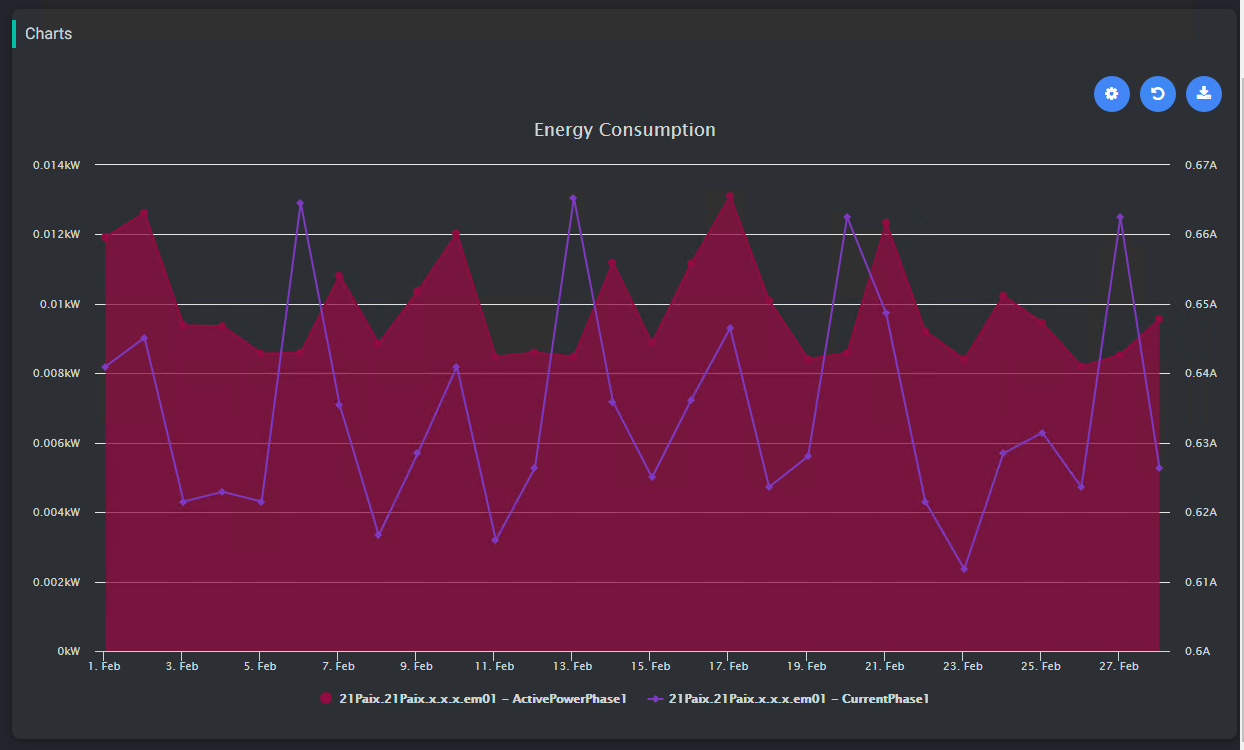
This card displays trends of selected histories. Histories can be selected from a general query (all metering histories for example) or from their extensions (get every point that has an extension beneath this device)


Implementation
The system will choose the right aggregation, the right type of charts, the right color automatically based on tags. To prepare your data for it, you can follow this tutorial: Configuring General Resources for histories
When the FlexView isn't in Edit mode, it is possible to drag and drop an history, a point or an historyExtension from the navigation tree to visualize the values from the history. When refreshs, the drag & dropped values will no longer been displayed.
See Master Slave behavior between cards to have more information on how to use it with other cards
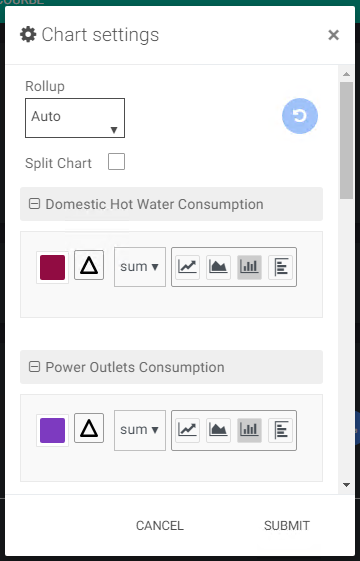
When clicking at the cog, it is possible to personalize charts settings (rollup, color, type of chart...). This settings are saved in the local environment, so it isn't shared between stations and browser environments.
It is possible to specify the rollup interval, the aggregation and for each chart, a color, a chart type and if it has to apply a delta. The rollup interval uses the same interval used in Niagara chart builder.
Flex Widget Properties
Min Max Auto: Boolean to scale the chart automatically (will override min-max facets from histories)
Export feature:
PNG | CSV | SVG | version | ||
|---|---|---|---|---|---|
| >= 80.0.361.50 |
Additional Features
You can drag&drop an history from the nav tree (both Workbench and Web browser) to create a new chart. In this case the new history isn't saved after refreshing the page.
Examples
Training
You can follow this e-learning course to practice