
Used as
-
Card
Summary
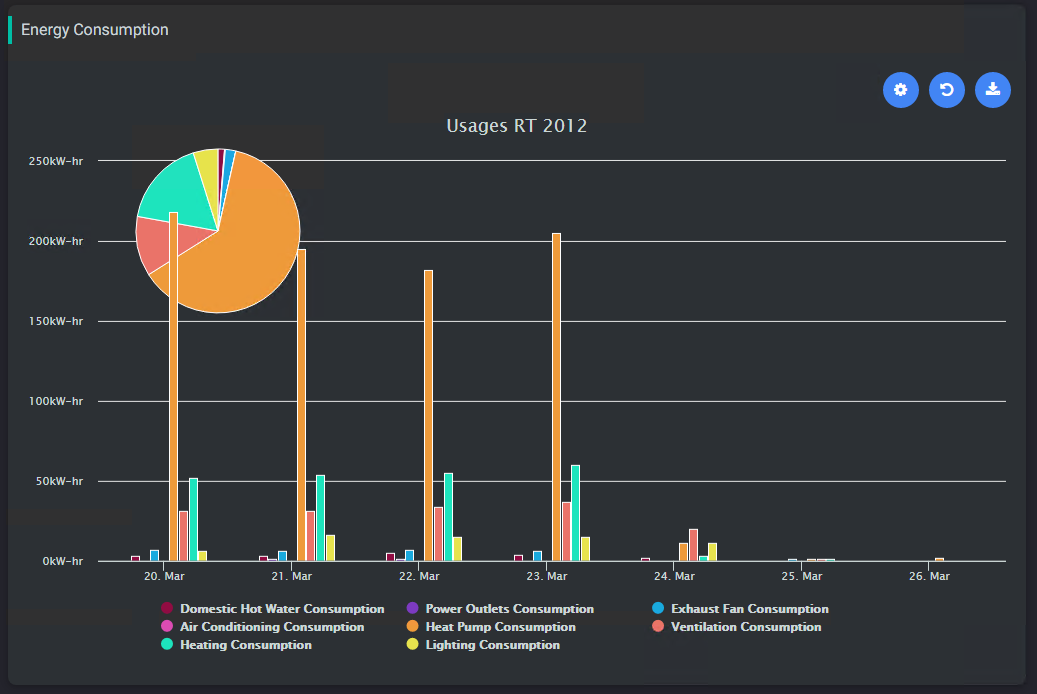
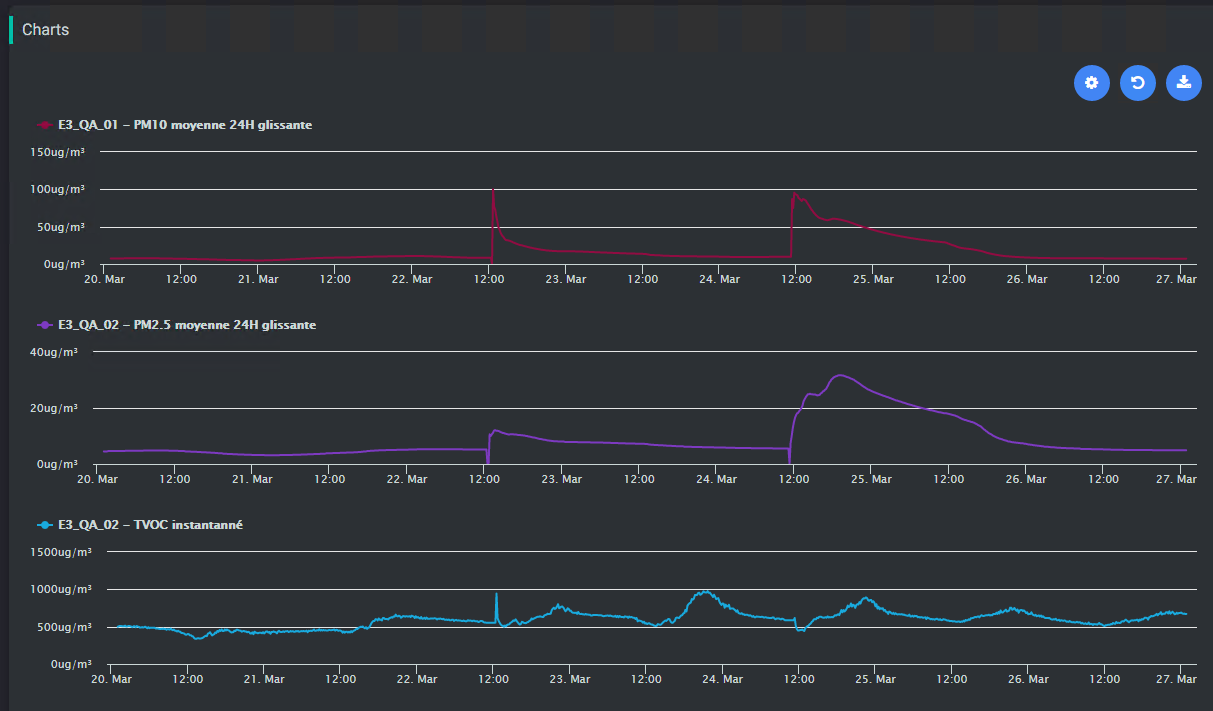
This card displays trends of selected histories. Histories can be selected from a general query (all metering histories for example) or from their extensions (get every point that has an extension beneath this device)
Status handling and rollup behavior
The chart behavior may differ depending on whether the standard Niagara rollup or the custom chart processing is used.
-
Niagara native rollup only processes history records whose status is
ok. -
In our ChartViewer implementation, when
Include All Statusis enabled, histories from numeric points may also include records with statusdown, in addition tookvalues. -
In the ChartViewer, only numeric histories use the rollup. Rollup is not supported for boolean and enum charts.
Implementation
-
Add a card from the settings bar, and choose in the list ChartViewer, or drop an history from the navTree into the flex view (it will set a default configuration for the chart)
-
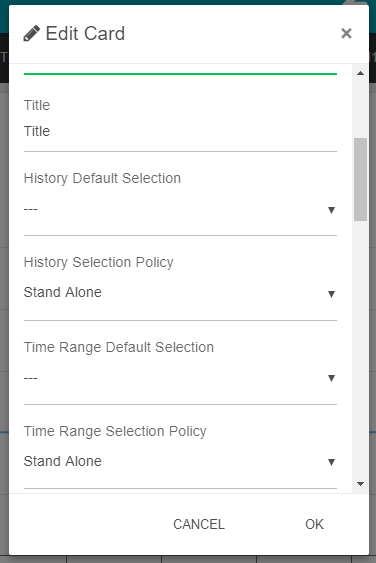
Fill-in a title
-
Decide how you are going to manage the card with histories:
-
By just drag&dropping histories from the Tridium nav tree inside the ChartViewer (but nothing is saved)
-
In combination with other cards such as HistoryListSelector or ChartBookmarks. In this case, select "Slave" in the History Default Selection" property
-
From a selection : in this case you use a query to retrieve the histories. The query is a Selection from the BtibService. There are two types of queries you can make:
-
On histories. Example: station:|history:|select id where dimension = 'Energy'
-
On extensions (absolute or relative). Example: slot:|bql: select * from history:HistoryExt
-
-
-
Decide how you are going to manage the card regarding the time:
-
By selecting a period on the top. Select a default Time Range to apply or "today" will be used. TimeRange are set up in the BtibService.
-
In combination with other cards such as PeriodSelector. In this case, select "Slave" in the "Time Range Selection Policy property"
-
-
Don't forget to accept the permissions.
The system will choose the right aggregation, the right type of charts, the right color automatically based on tags. To prepare your data for it, you can follow this tutorial: Configuring General Resources for histories
When the FlexView isn't in Edit mode, it is possible to drag and drop an history, a point or an historyExtension from the navigation tree to visualize the values from the history. When refreshs, the drag & dropped values will no longer been displayed.
See Master Slave behavior between cards to have more information on how to use it with other cards
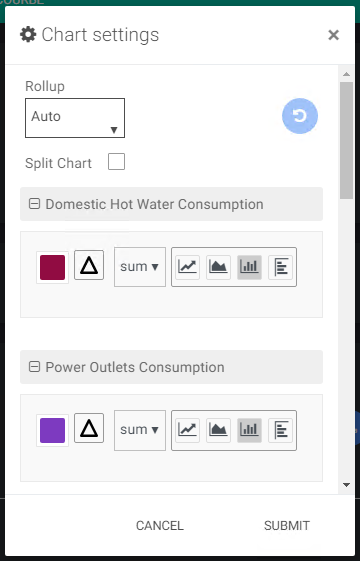
When clicking at the cog, it is possible to personalize charts settings (rollup, color, type of chart...). This settings are saved in the local environment, so it isn't shared between stations and browser environments.
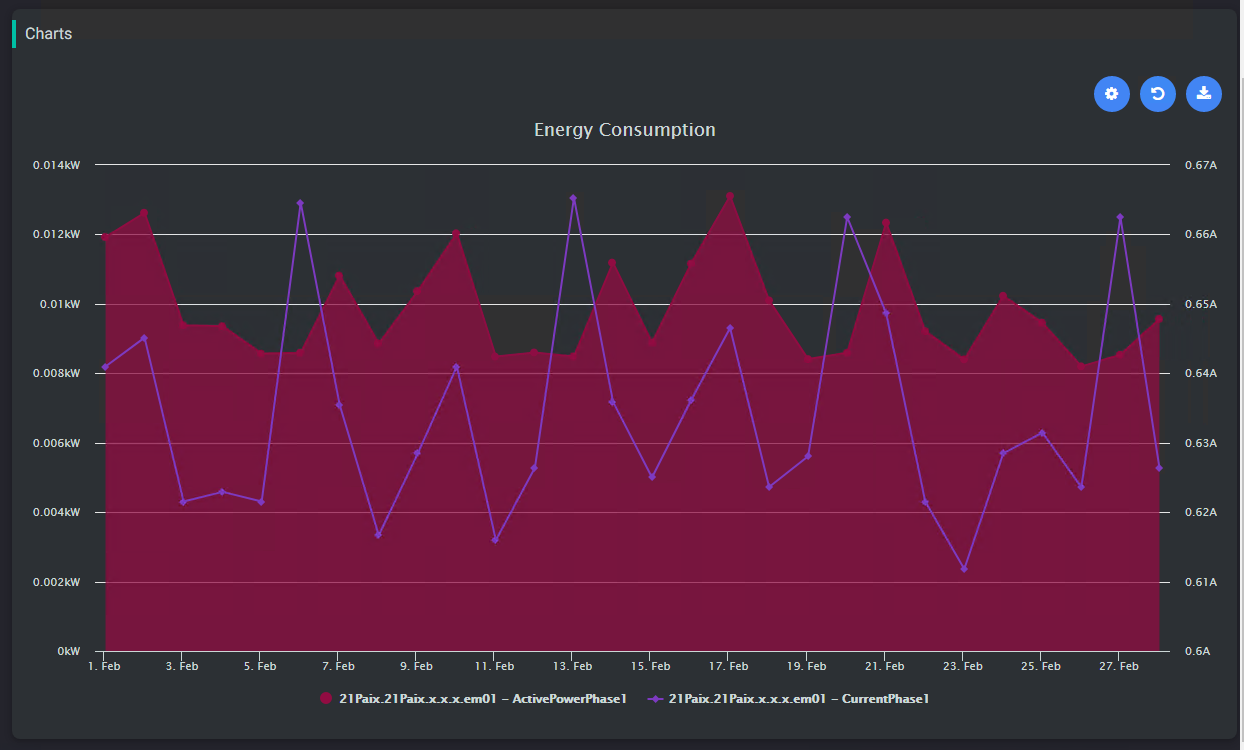
It is possible to specify the rollup interval, the aggregation and for each chart, a color, a chart type and if it has to apply a delta. The rollup interval uses the same interval used in Niagara chart builder.
Flex Widget Properties
-
Title: The title of the card
-
HistoryDefaultSelection: A list of selection retrieved from the Selection folder in the BtibService. The selection needs to target histories (history:) or historyExtensions (slot:)
-
HistorySelectionPolicy:
-
Stand Alone: The card will use the default history selection
-
Slave: The history selection is given by another card like HistoryListSelector
-
-
TimeRangeDefaultSelection: The default period (a TimeRangeDefinition) applied on the first display. If no value is defined (value
---), the ChartViewer uses a default time range corresponding to the last 24 hours.The display then depends on the available data:
-
If values exist over the entire period, the chart will cover the full 24 hours
-
If the data is partial, the chart will only display the time range where values are available
-
-
TimeRangePolicy:
-
Stand Alone: The widget displays a dropdown to select a period (month to date, last year...)
-
Slave: The period is given by another widget like a period selector.
-
-
yAggregation: whether to apply an aggregation (sum, min, max...) defined by the tags in the histories or to let the raw values
-
Format: The text to display for each history. Example: %historyDisplayName% or %id%
-
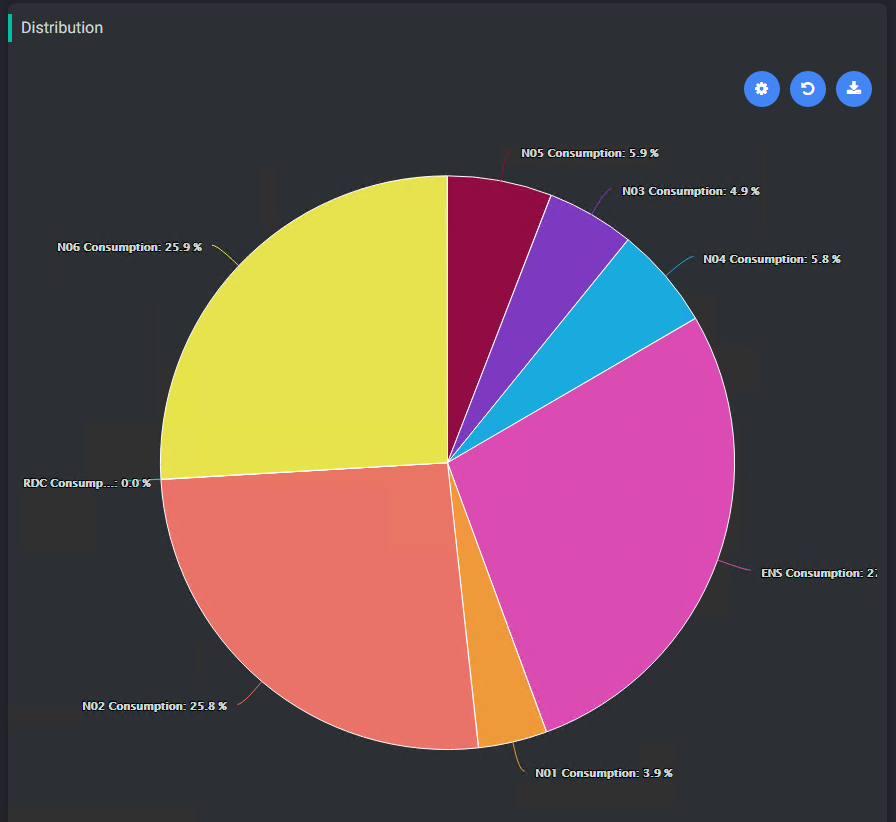
Pie Policy:
-
Embedded: Show the Pie Chart embedded with the others Charts
-
Full View: Show the Pie Chart only
-
None: Hide Pie Chart
-
-
Free Color Mode: Whether to take the colors from tags, or auto select colors. See Configuring General Resources for histories
-
Split chart: Will shift every chart to be on the top of each other
-
Pie Position:
-
Backward: Pie Chart will be behind the other charts
-
Forward: Pie Chart will be in front of other charts
-
-
Refresh: Timer to force the refresh of the chart. Default value is 0 and will not refresh the card
-
Min Max Auto: Boolean to scale the chart automatically (will override min-max facets from histories)
-
Plot Lines:
-
Enable max: Enable max plotLine and allow to choose color. By default, the max line takes the highest displayed value based on the selected period.. It is possible to set the value of the line by setting the maxFormat with an sFormat. Make sure that the sFormat resolve a Double and not another type.
-
Enable min: Enable min plotLine and allow to choose color. By default, the max line takes the lowest displayed value over the selected period. It is possible to set the value of the line by setting the minFormat with an sFormat. Make sure that the sFormat resolve a Double and not another type.
-
-
Chart Background: Background color of the chart
-
Legend Foreground: Foreground of legends and axis
-
Export Date Format: Date format when exporting in csv (%Y-%m-%d %H:%M:%S by default)
Notes / Limitations
-
Rollup and statuses
In the ChartViewer, the rollup is enabled only for numeric histories with an interval selected with an operator (standard deviation doesn’t work).
By default, the rollup used is Tridium’s one. When using it, you will see some limitations. The results will ignore rows with one of those status will be ignored disabled, fault, down, stale.
Here is an example:
history:/active/NumericWritable?period=timeRange;start=2026-04-19T17:00:24.081+02:00;end=2026-04-20T17:00:24.081+02:00|bql:history:HistoryRollup.rollup(history:RollupInterval 'fiveMin')
When the option Include All Status is enabled, we use a custom rollup that will include all the rows regardless of its status.
Here is an example:
history:/active/NumericWritable?period=timeRange;start=2026-04-19T17:19:04.906+02:00;end=2026-04-20T17:19:04.906+02:00|bql:btibCore:CustomRollup.rollup(history:RollupInterval 'fiveMin') -
String histories
Niagara does not support chart visualization for histories of type String.
As a result, the ChartViewer card can still be displayed, but the chart itself will not render data for histories coming from String points.
Export feature:
|
|
PNG |
|
CSV |
SVG |
version |
|---|---|---|---|---|---|
|
|
|
|
|
|
|
|
|
|
|
|
|
|
|
|
|
|
|
|
>= 80.0.361.50 |
Additional Features
You can drag&drop an history from the nav tree (both Workbench and Web browser) to create a new chart. In this case the new history isn't saved after refreshing the page.
Examples
Training
You can follow this e-learning course to practice