Description
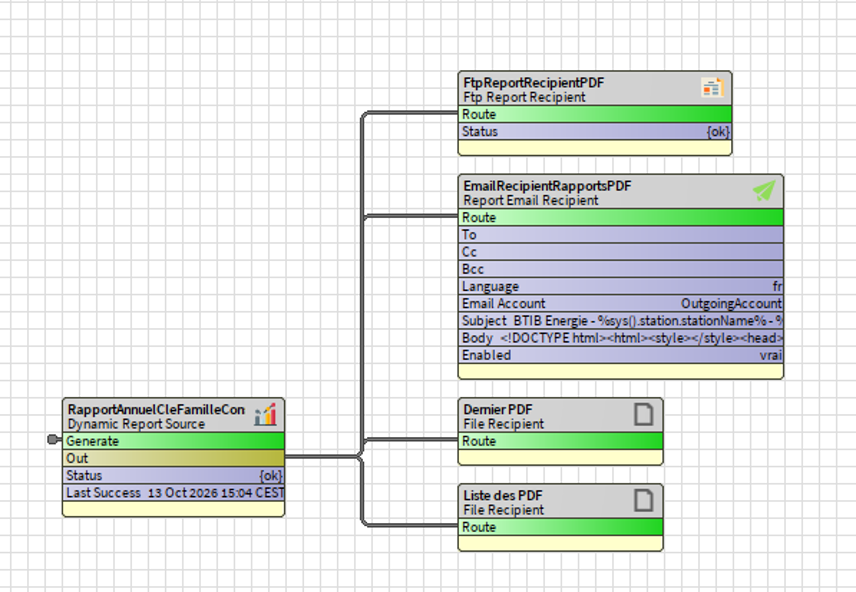
The DynamicReportSource Component is used to provide a dynamic data source for px-based reports. It is generally used with variables and LiveChart Templates to build graphics and charts that will be displayed inside the report px file, which is then used to generate a PDF report. Then it can be linked to recipients like Report Email Recipient or Ftp recipient to send the report.
For example, it is used to create:
-
Energy consumption reports
-
HVAC performance summaries
-
Alarm and event reports
-
Historical trend analysis
-
Maintenance and operational reports
Implementation
Deployment
-
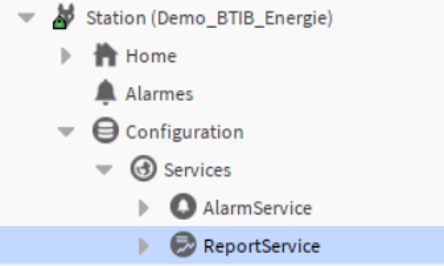
A ReportService is fisrt needed to be pasted in Services
-
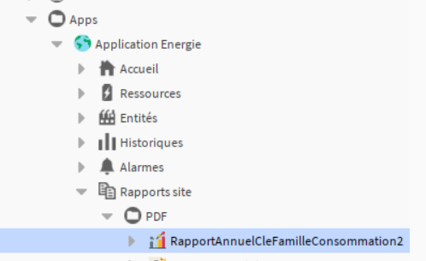
Copy / Paste the component into your station
Set px parameters
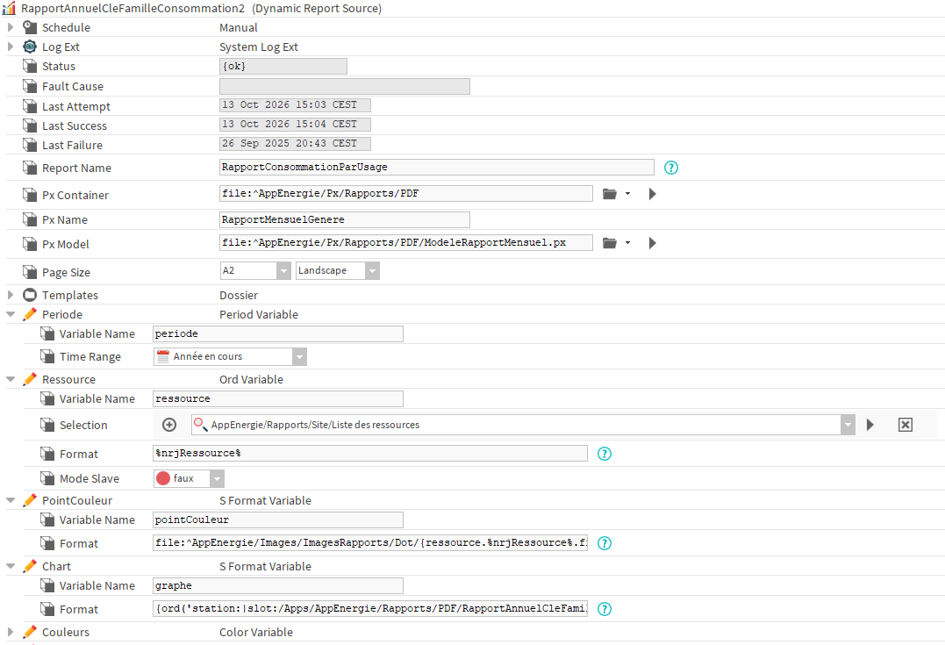
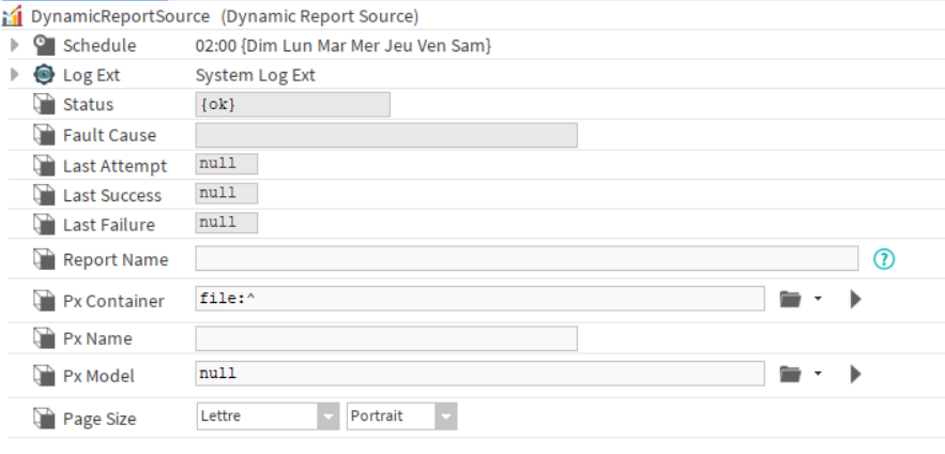
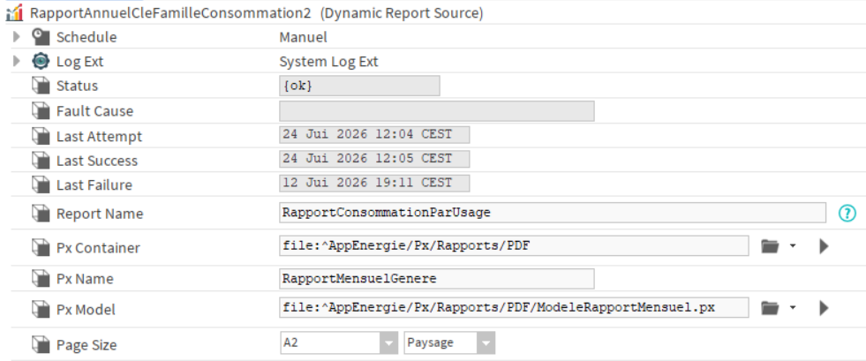
Set the different parameters like the generation mode or the Px file, model and name
-
Report Name: name of the generated PDF report. You can use SFormat to generate relative Report’s Name.
-
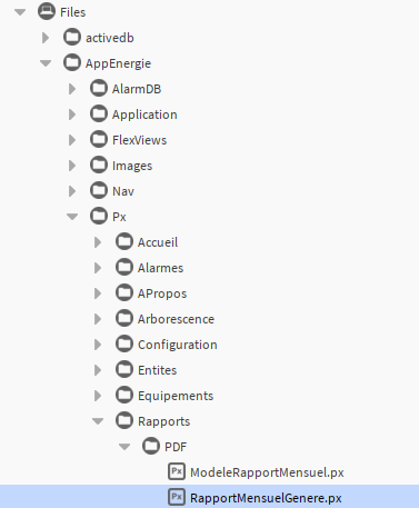
Px Container: the destination path of the generated px view
-
Px Name: name of the generated px
-
Px Model: px template used to generate the px report. It is possible to define px view templates using conditions related to the results of the BQL query. The first true condition found applies.
-
Page Size: size and orientation of report’s pages
Set Variables
Add variables that will be used inside the report px
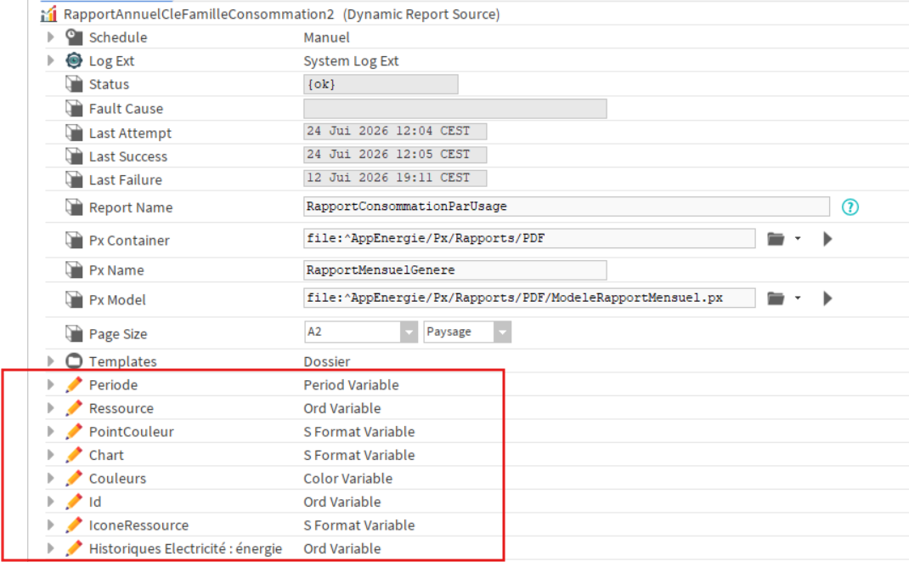
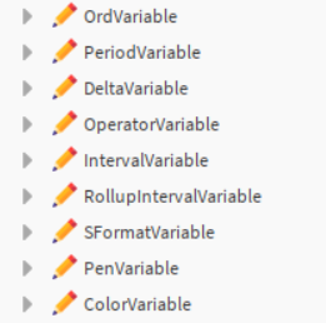
There are several types of variables:
-
Ord variable: store the result of a selection. It is typically used to dynamically reference a Niagara object, history, station component, or data source
-
PeriodVariable: defines a period used for data extraction and report generation. It allows the user to specify a predefined reporting period such as Today, Yesterday, Last Week, Last Month, or a custom date range.
-
DeltaVariable:
-
OperatorVariable: defines the logical or mathematical operator used in report calculations. You can choose between: First, Last, Sum, Average, Product, Min, Max, Or, And, Count and None
-
IntervalVariable: determines the sampling or aggregation interval used when retrieving historical data. This variable controls the granularity of the displayed data.
-
RollupIntervalVariable: specifies the interval used to aggregate historical records into summarized values. It is commonly used to generate hourly, daily, weekly, or monthly averages, minimums, maximums, or totals from raw trend data.
-
SFormatVariable: variable retrieves by SFormat.
-
PenVariable: defines the pen configuration used in charts and trend visualizations. It includes settings such as line style, thickness, visibility. You can set a condition to apply format.
-
ColorVariable: specifies the color assigned to report elements such as chart pens, text, indicators, or graphical components. It allows visual customization and helps distinguish different data series or report categories.
Set Graphics
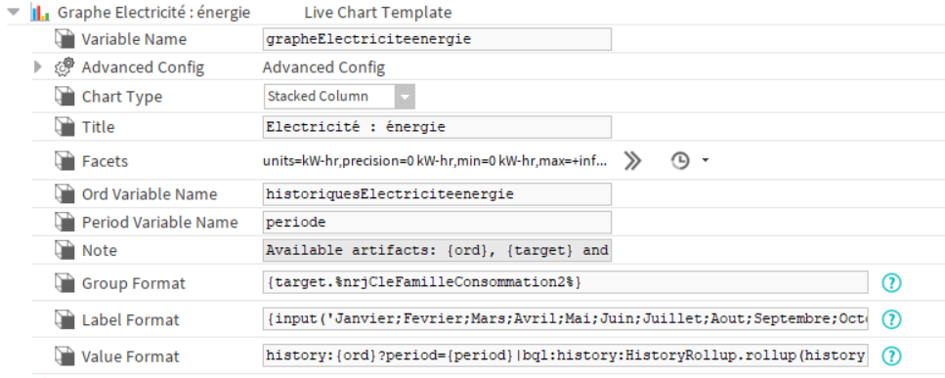
Add chart templates, that will be used inside the report px
-
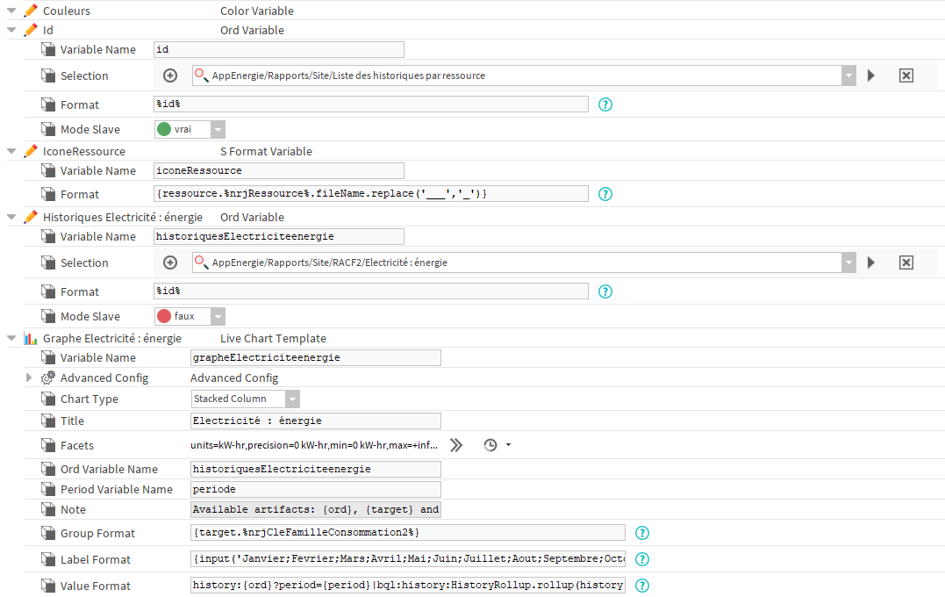
Variable Name: Name of the variable used to reference this chart in the PX report
-
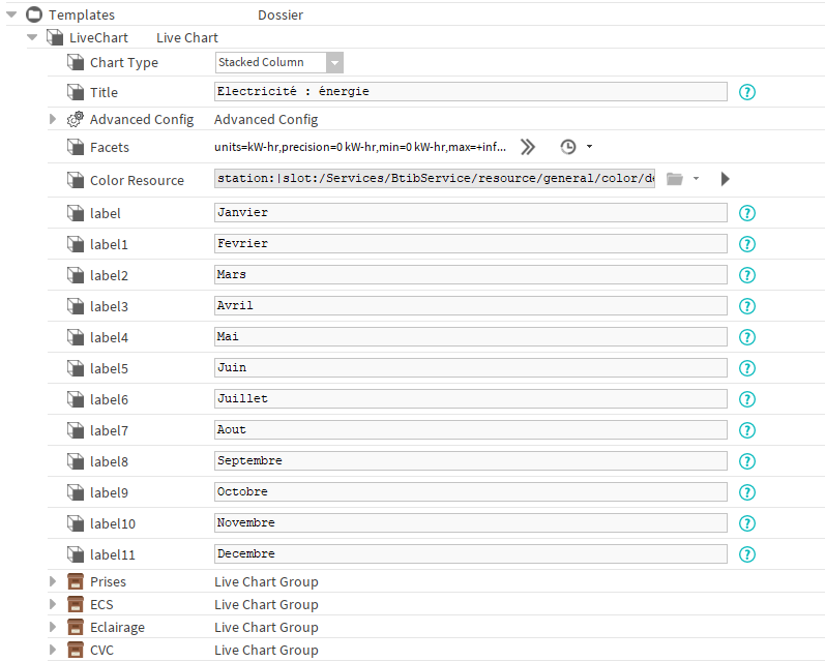
Chart Type: Defines the chart type to generate (Column / Spider Web / Pie / Stacked Column)
-
Title: Title displayed above the chart
-
Facets: Configures display settings such as units, precision, minimum, and maximum values
-
Ord Variable Name: Name of the variable containing the history ORD used as the chart data source. Same Name as the variable name defined above (cf “Set variables paragraph”)
-
Period Variable Name: Name of the variable containing the reporting period (defined above)
-
Note: Information about the variables available within the template
-
Group Format: Defines how data series are grouped. Data is often grouped using a Niagara tag (such as a usage, building, or equipment tag) to aggregate values belonging to the same category and display them as a single series in the chart.
-
Label Format: Defines the labels displayed on the X-axis (here, the months of the year)
-
Value Format: Defines the query used to retrieve and aggregate historical data for the chart
Configure Model Px
The PX model defines the layout and visual structure of the report that will be converted into a PDF. It acts as a template where text, tables, charts, and report variables are dynamically filled during report generation.
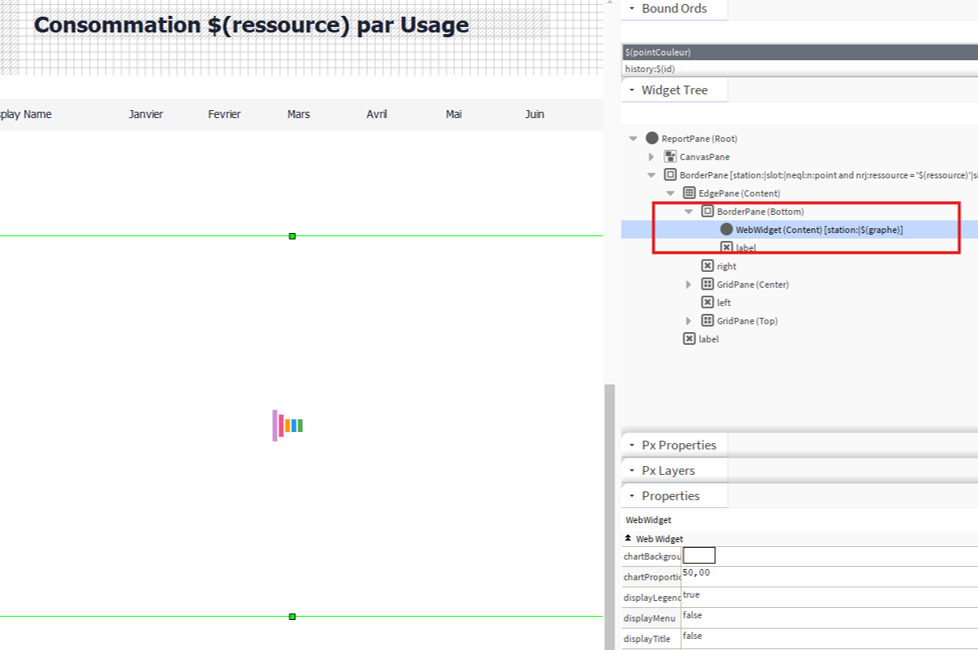
Variables previously configured in the DynamicReportSource can be referenced directly in the PX using the syntax: $(variableName)
For exemple, the “$(graphe)” variable contains a chart generated by a Live Chart Template. In this PX model, a WebWidget is bound to $(graphe) so that the chart is automatically displayed in the report and included in the generated PDF.
Note:
It is important to use a ReportPane as the root container of the PX file, as it is specifically designed for report rendering and PDF generation. All report content, including text, tables, images, and charts, should be placed inside the ReportPane to ensure proper layout and successful PDF export.
Important:
PDF report generation from a JACE is limited by its available memory and processing power. As a result, complex PX exports, especially those containing WebWidgets, are not supported and may fail. PDF report generation should preferably be performed on a SUP station rather than directly on a JACE.
Generate Report
Generate your report by clicking on “Generate” Action
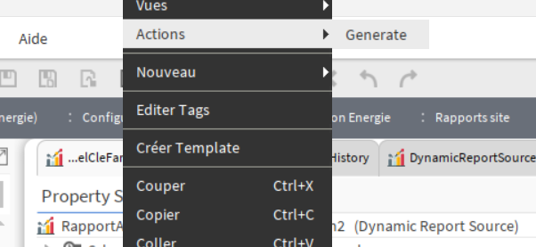
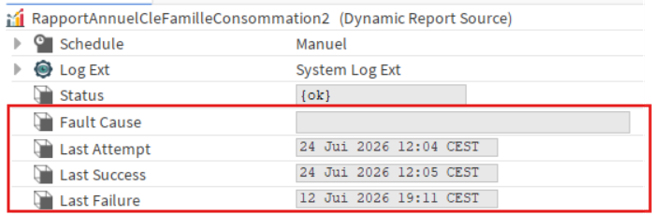
Check if there is a failure inside FaultCause slot :
You can find your file in the defined directory:
Properties
-
Schedule: defines the generation mode between manual, interval, or daily
-
Status: status of the report source
-
FaultCause: displays the reason for the last error, if any
-
LastAttempt: Indicates the date of the last report generation attempt
-
LastSuccess: Indicates the date of the last report generation export
-
LastFailure: Indicates the date of the last failure to generate reports
Actions
Generate: Launches the generation of the report
Additional informations
When the first report generation is done, a ‘Template’ folder appears (hidden slot). It contains the built charts whith parameter chosen inside LiveChart Templates variables.
Example