
Debug mode permits visualization of the path of the Nodes hidden behind the selected display name.
It is activated in the AdvancedConfig component of the InfoSource.

Activating this mode makes it possible to display:
-
A debug console that displays the different paths
-
A debug icon on all items in the drop-down lists
When clicking on the debug icon, the system displays all possible paths. This allows you to see which Nodes are hiding behind a display name.
In the example below, we clicked on the debug icon of "Office A101". It can be seen that there are actually two "Office A101" Nodes, one located in Building A, the other in Building B.
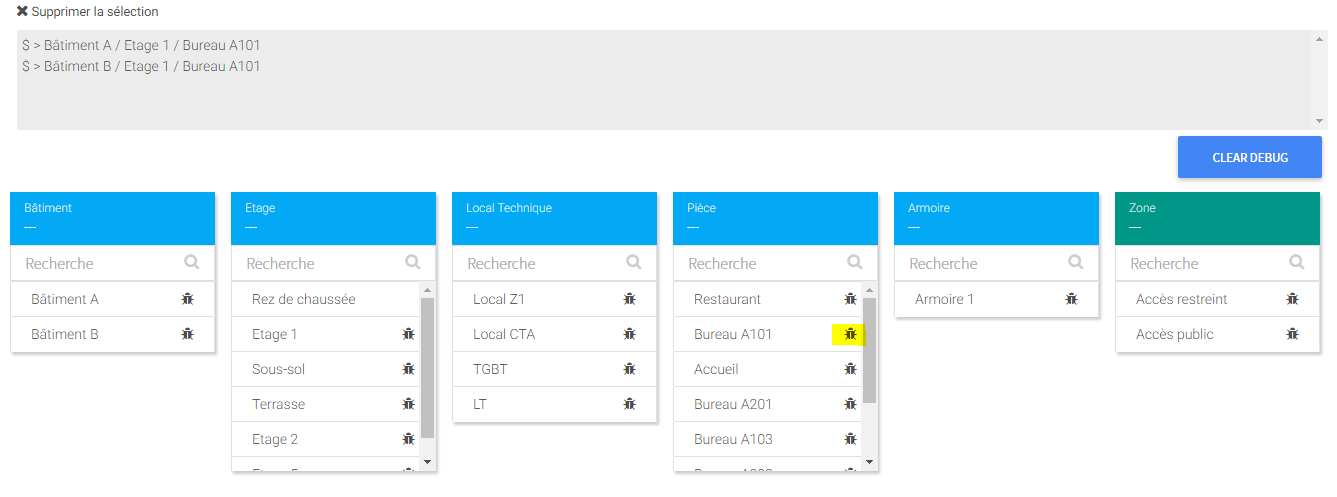
To clear the console, click on the "Clear Debug" button.