
Used as
-
Card
Summary
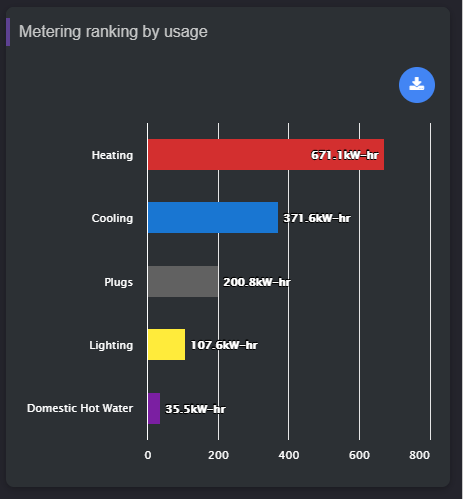
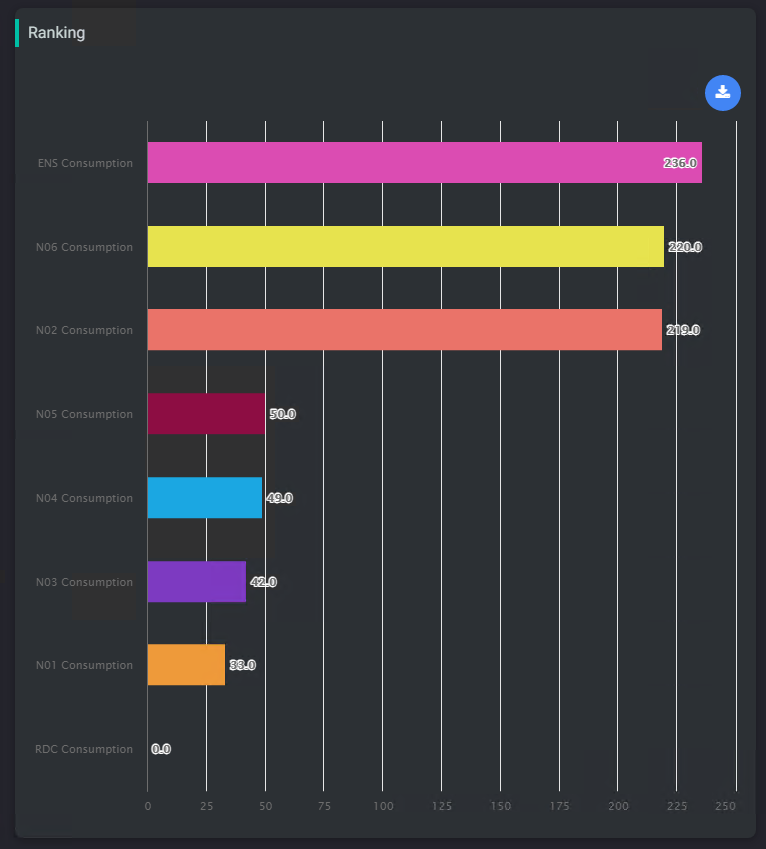
This card displays a ranking chart of selected histories. Histories can be selected from a general query (all metering histories for example) or from their extensions (get every point that has an extension beneath this device)
Implementation
There are two ways to add it to the FlexPane:
-
Add a card from the settings bar, and choose in the list RankingChart
-
Or drag&drop a component into a FlexView
Then
-
Fill-in a title
-
Select the query to retrieve the records from. The query is a Selection from the BtibService. There are two types of queries you can make:
-
On histories. Example: station:|history:|select id where dimension = 'Energy'
-
On extensions (absolute or relative). Example: slot:|bql: select * from history:HistoryExt
-
-
Select a default Time Range to apply. TimeRange are set up in the BtibService.
-
Select a Policy for TimeRange and Selection (Master or Slave)
The system will choose the right color automatically based on tags. To prepare your data for it, you can follow this tutorial: Configuring General Resources for histories
When the FlexView isn't in Edit mode, it is possible to drag and drop an history, a point or an historyExtension from the navigation tree to visualize the values from the history. When refreshs, the drag & dropped values will no longer been displayed.
Flex Widget Properties
-
Title: The title of the card
-
Selection: A list of selection retrieved from the Selection folder in the BtibService. The selections need to point histories (history:) or historyExtensions (slot:)
-
Default Time Range: The default period (a TimeRangeDefinition) applied on the first display. If nothing is provided, it will display the last 24 hours
-
TimeRangePolicy: Stand Alone: The widget displays a dropdown to select a period (month to date, last year...)Slave: The period is given by another widget like a period selector.
-
SelectionPolicy: Stand Alone: Take the histories from the selection fieldSlave: Take the histories given from another widget like a HistoryListSelector.
-
yAggregation: whether to apply an aggregation (sum, min, max...) defined by the tags in the histories or to let the raw values
-
Format: The text to display for each history. Example: %historyDisplayName% or %id%
-
Free Color Mode: Whether to take the colors from tags, or auto select colors
-
Alignment: Alignment of charts
-
Sort: Descending or ascending
-
Chart Background: Background color of the chart
-
Legend Foreground: Foreground of legends and axis